SciChart.js JavaScript 2D Charts API > Accessibility > Voice Over
Voice Over

To achieve voice over the chart elements, data, and some actions, we can use the Hit Test API and event subscription.

Possible use-cases:

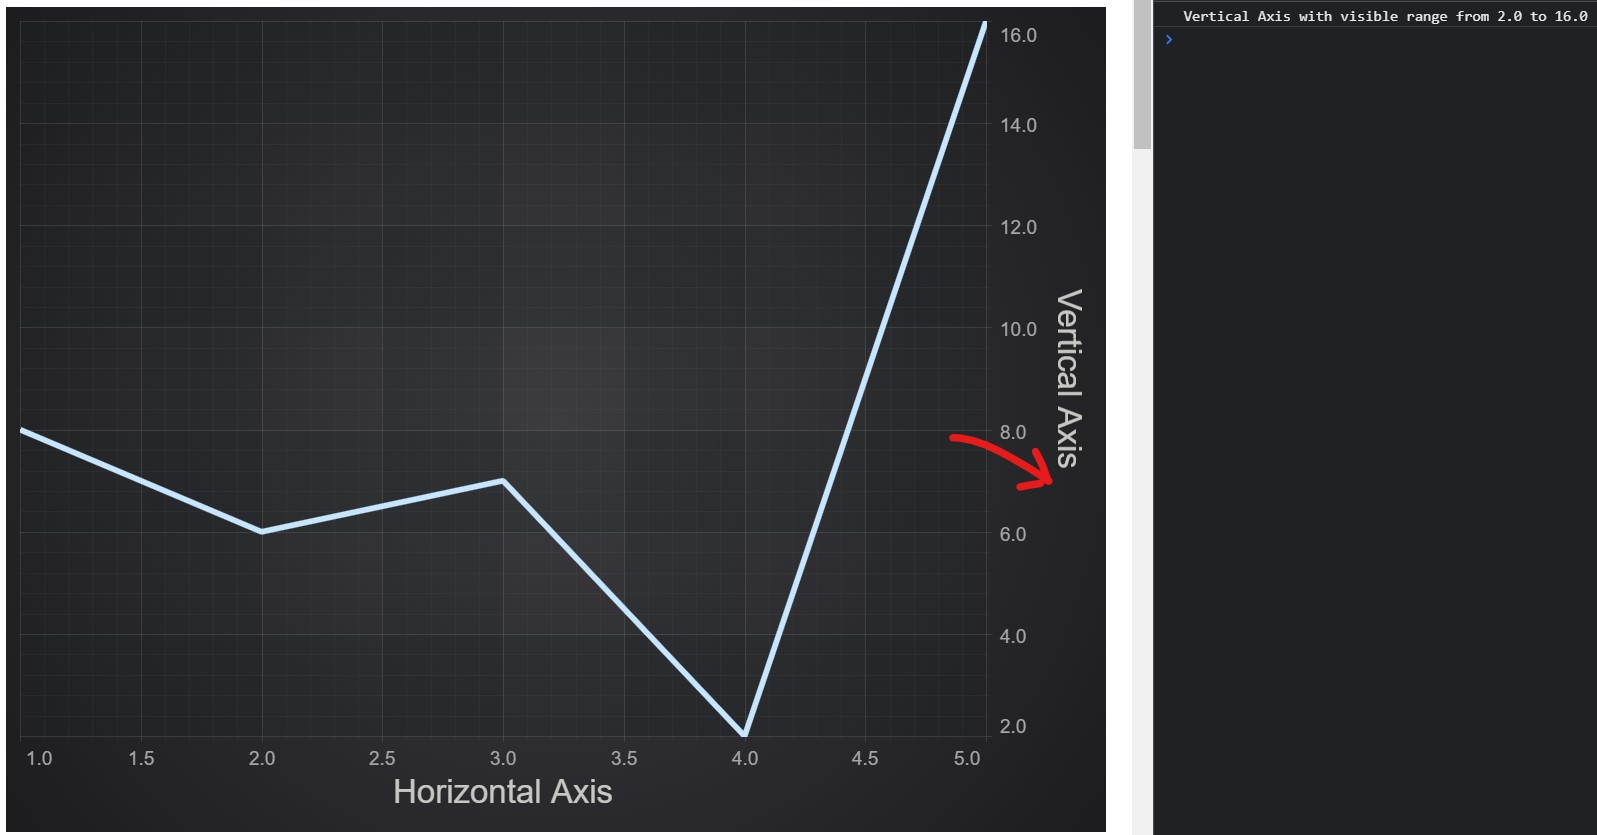
  • User selects axes with the voice over reading the range of the axis that is visible on the screen.
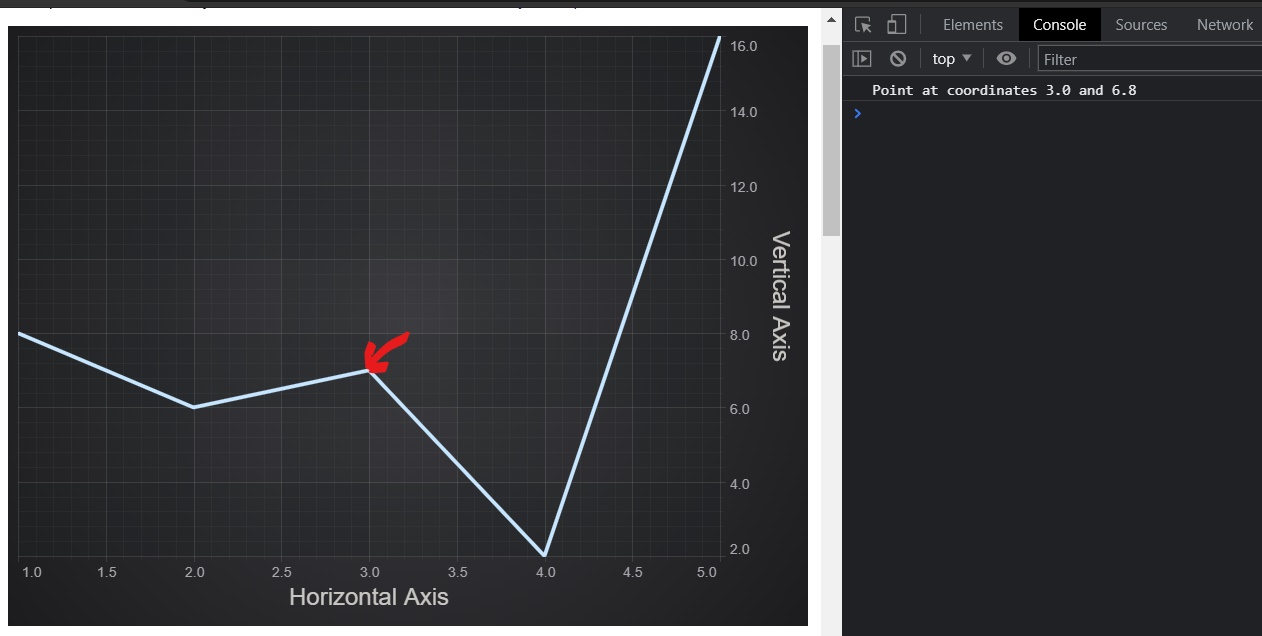
  • User clicks on a series data point with the voice over reading the coordinates of the selected point.
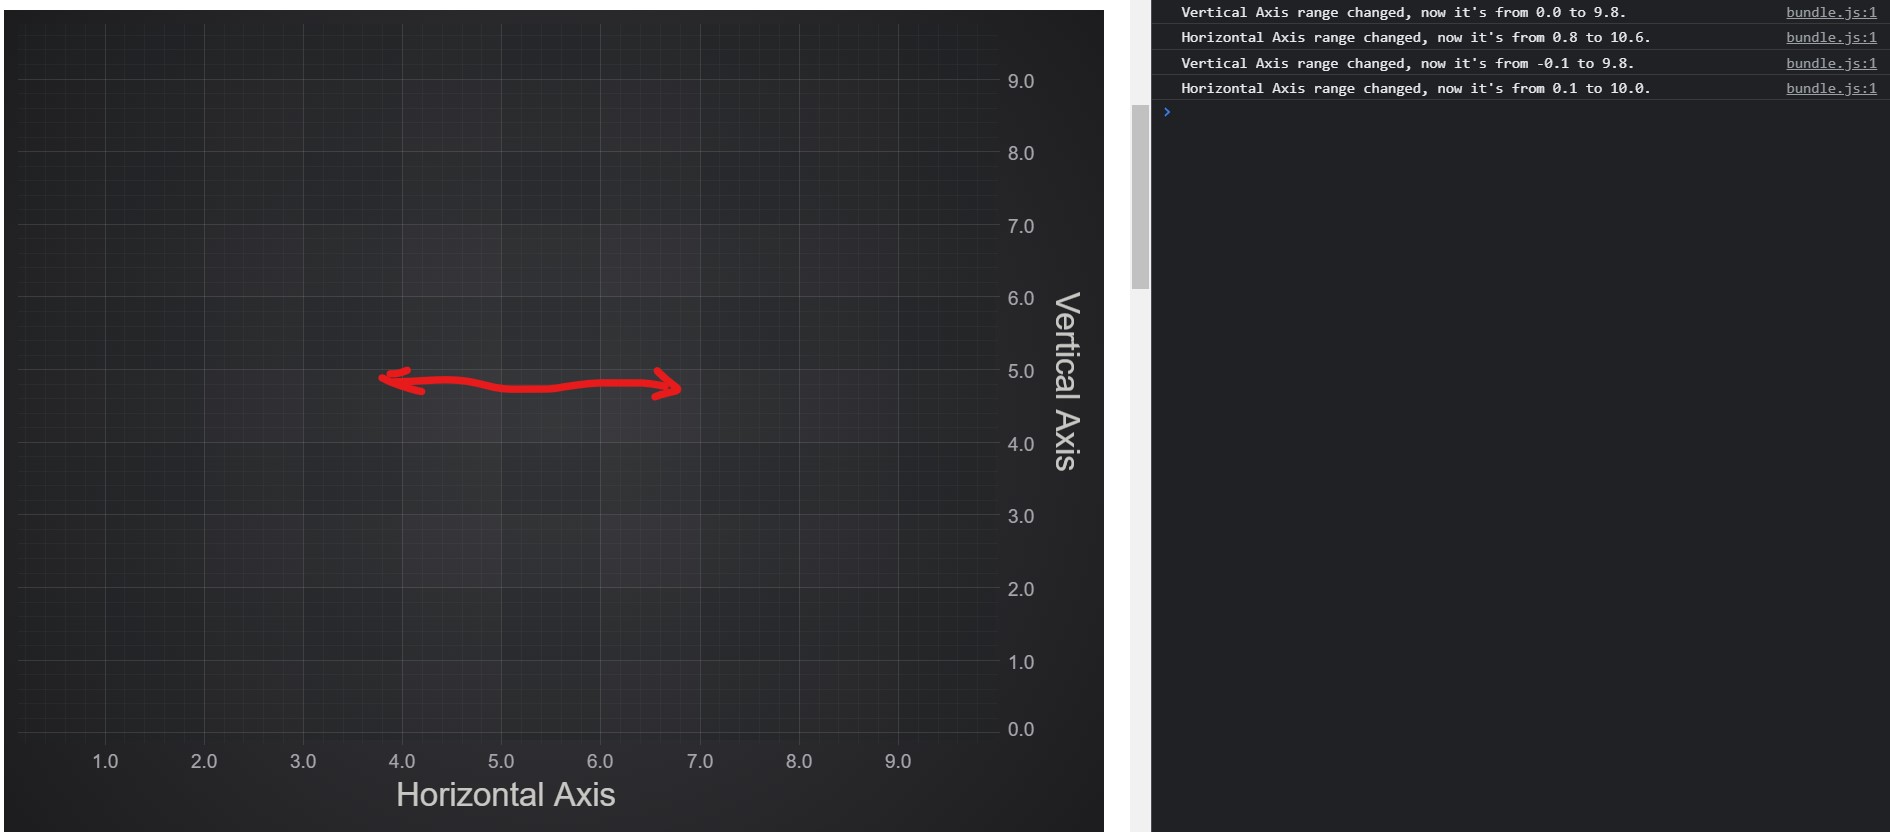
  • User zooms or pans chart with the voice over describing the new visible ranges of the axes.

Adding VoiceOver to Data Series using HitTest API

This example demonstrates how to add VoiceOver to announce points on FastLineRenderableSeries. Voice over functionality is provided by SpeechSynthesisUtterance API.

1. We will start from a basic chart definition:

import { SciChartSurface } from "scichart";
import { NumericAxis } from "scichart/Charting/Visuals/Axis/NumericAxis";
import { FastLineRenderableSeries } from "scichart/Charting/Visuals/RenderableSeries/FastLineRenderableSeries";
import { XyDataSeries } from "scichart/Charting/Model/XyDataSeries";
// ...
const { wasmContext, sciChartSurface } = await SciChartSurface.create(divElementId);
const xAxis = new NumericAxis(wasmContext, { axisTitle: "Horizontal Axis" });
const yAxis = new NumericAxis(wasmContext, { axisTitle: "Vertical Axis" });
sciChartSurface.xAxes.add(xAxis);
sciChartSurface.yAxes.add(yAxis);
const dataSeries = new XyDataSeries(wasmContext, {
    dataSeriesName: "Primary Data Series",
    xValues: [1, 2, 3, 4, 5],
    yValues: [8, 6, 7, 2, 16]
});
const renderableSeries = new FastLineRenderableSeries(wasmContext, { strokeThickness: 5, dataSeries });
sciChartSurface.renderableSeries.add(renderableSeries);

 This definition instantiates a chart with named axes and line series.

2. Subscribe to mouse click events on the chart:

const hitTestDataPoints = (point) => {
    // event handler logic
    // ...
};
// add voice over for data points
sciChartSurface.domCanvas2D.addEventListener("mousedown", (mouseEvent) => {
    const point = new Point(mouseEvent.offsetX, mouseEvent.offsetY);
    hitTestDataPoints(point);
});
import { Point } from "scichart/Core/Point";
// ...
const hitTestDataPoints = (point: Point) => {
    // event handler logic
    // ...
};
// add voice over for data points
sciChartSurface.domCanvas2D.addEventListener("mousedown", (mouseEvent: MouseEvent) => {
    const point = new Point(mouseEvent.offsetX, mouseEvent.offsetY);
    hitTestDataPoints(point);
});

 3. Add logic to check if line series are clicked in hitTestDataPoints:

import { DpiHelper } from "scichart/Charting/Visuals/TextureManager/DpiHelper";
// ...
const hitTestDataPoints = (point) => {
    const HIT_TEST_RADIUS = 10 * DpiHelper.PIXEL_RATIO;
    sciChartSurface.renderableSeries.asArray().forEach(series => {
        if (series.hitTestProvider) {
            const hitTestInfo = series.hitTestProvider.hitTest(
                point.x * DpiHelper.PIXEL_RATIO,
                point.y * DpiHelper.PIXEL_RATIO,
                HIT_TEST_RADIUS,
            );
            if (hitTestInfo.isHit) {
                voiceOverDataPoint(series, hitTestInfo);
            }
        }
    });
};
import { DpiHelper } from "scichart/Charting/Visuals/TextureManager/DpiHelper";
// ...
const hitTestDataPoints = (point: Point) => {
    const HIT_TEST_RADIUS = 10 * DpiHelper.PIXEL_RATIO;
    sciChartSurface.renderableSeries.asArray().forEach(series => {
        if (series.hitTestProvider) {
            const hitTestInfo = series.hitTestProvider.hitTest(
                point.x * DpiHelper.PIXEL_RATIO,
                point.y * DpiHelper.PIXEL_RATIO,
                HIT_TEST_RADIUS,
            );
            if (hitTestInfo.isHit) {
                // here we will do the VoiceOver
                voiceOverDataPoint(series, hitTestInfo);
            }
        }
    });
};

 Notice that coordinates passed to the Hit Test method are multiplied by DpiHelper.PIXEL_RATIO to be scaled accordingly to display and browser configurations. See also Retina Support and Browser ZoomHit Test API Documentation.

4. Now let's define the voiceOverDataPoint function which will format the coordinates and announce them using VoiceOver:

const voiceOverDataPoint = (series, hitTestInfo) => {
    const { hitTestPointValues } = hitTestInfo;
    const xCoordValue = series.xAxis.labelProvider.formatLabel(hitTestPointValues.x);
    const yCoordValue = series.yAxis.labelProvider.formatLabel(hitTestPointValues.y);
    const pointDescription = `Point at coordinates ${xCoordValue} and ${yCoordValue}`;
    announcePointOnDataSeries(pointDescription);
}
import { HitTestInfo } from "scichart/Charting/Visuals/RenderableSeries/HitTest/HitTestInfo";
import { IRenderableSeries } from "scichart/Charting/Visuals/RenderableSeries/IRenderableSeries";
// ...
const voiceOverDataPoint = (series: IRenderableSeries, hitTestInfo: HitTestInfo) => {
    const { hitTestPointValues } = hitTestInfo;
    const xCoordValue = series.xAxis.labelProvider.formatLabel(hitTestPointValues.x);
    const yCoordValue = series.yAxis.labelProvider.formatLabel(hitTestPointValues.y);
    const pointDescription = `Point at coordinates ${xCoordValue} and ${yCoordValue}`;
    announcePointOnDataSeries(pointDescription);
}

where announcePointOnDataSeries is implemented as following:

const announceWithSpeechSynthesis = (announcement) => {
    console.log(announcement)
    const synthDescription = new SpeechSynthesisUtterance(announcement);
    window.speechSynthesis.speak(synthDescription);
};
const debounce = (func, timeout = 1000) => {
    let timer;
    return (...args) => {
        clearTimeout(timer);
        timer = setTimeout(() => func(...args), timeout);
    };
};
const announcePointOnDataSeries = debounce(announceWithSpeechSynthesis);
const announceWithSpeechSynthesis = (announcement: string) => {
    console.log(announcement)
    const synthDescription = new SpeechSynthesisUtterance(announcement);
    window.speechSynthesis.speak(synthDescription);
};
const debounce = (func: (...params: any) => void, timeout = 1000) => {
    let timer: NodeJS.Timeout;
    return (...args: any) => {
        clearTimeout(timer);
        timer = setTimeout(() => func(...args), timeout);
    };
};
// additionally debounce the speech synthesis generation
const announcePointOnDataSeries = debounce(announceWithSpeechSynthesis);

 Now upon clicking on a point of the line series we should get its coordinates announced with speech synthesis and logged to the console.

 VoiceOver for Axes

VoiceOver upon chart axes also could be easily implemented:

const hitTestAxes = (point) => {
    sciChartSurface.xAxes.asArray().forEach(axis => {
        if (isPointWithinAxis(point, axis)) {
            announceAxis(axis);
        }
    });
    sciChartSurface.yAxes.asArray().forEach(axis => {
        if (isPointWithinAxis(point, axis)) {
            announceAxis(axis);
        }
    });
}
// add voice over for data points and axes
sciChartSurface.domCanvas2D.addEventListener("mousedown", (mouseEvent) => {
    const point = new Point(mouseEvent.offsetX, mouseEvent.offsetY);
    hitTestAxes(point);
    hitTestDataPoints(point);
});
const hitTestAxes = (point: Point) => {
    sciChartSurface.xAxes.asArray().forEach(axis => {
        if (isPointWithinAxis(point, axis)) {
            announceAxis(axis);
        }
    });
    sciChartSurface.yAxes.asArray().forEach(axis => {
        if (isPointWithinAxis(point, axis)) {
            announceAxis(axis);
        }
    });
}
// add voice over for data points and axes
sciChartSurface.domCanvas2D.addEventListener("mousedown", (mouseEvent: MouseEvent) => {
    const point = new Point(mouseEvent.offsetX, mouseEvent.offsetY);
    hitTestDataPoints(point);
    hitTestAxes(point);
});

 Here we have defined hitTestAxes function and used it in the event listener.

The announceAxis and isPointWithinAxis will look like this:

const announceAxis = debounce((axis) => {
    const from = axis.labelProvider.formatLabel(axis.visibleRange.min);
    const to = axis.labelProvider.formatLabel(axis.visibleRange.max);
    const axisDescription = `${axis.axisTitle} with visible range from ${from} to ${to} `;
    announceWithSpeechSynthesis(axisDescription);
});
const isPointWithinAxis = (point, axis) => {
    return point.x * DpiHelper.PIXEL_RATIO > axis.viewRect.left 
        && point.x * DpiHelper.PIXEL_RATIO < axis.viewRect.right
        && point.y * DpiHelper.PIXEL_RATIO > axis.viewRect.top 
        && point.y * DpiHelper.PIXEL_RATIO < axis.viewRect.bottom;
};
import { AxisBase2D } from "scichart/Charting/Visuals/Axis/AxisBase2D";
// ...
const announceAxis = debounce((axis: AxisBase2D) => {
    const from = axis.labelProvider.formatLabel(axis.visibleRange.min);
    const to = axis.labelProvider.formatLabel(axis.visibleRange.max);
    const axisDescription = `${axis.axisTitle} with visible range from ${from} to ${to} `;
    announceWithSpeechSynthesis(axisDescription);
});
const isPointWithinAxis = (point: Point, axis: AxisBase2D) => {
    return point.x * DpiHelper.PIXEL_RATIO > axis.viewRect.left 
        && point.x * DpiHelper.PIXEL_RATIO < axis.viewRect.right
        && point.y * DpiHelper.PIXEL_RATIO > axis.viewRect.top 
        && point.y * DpiHelper.PIXEL_RATIO < axis.viewRect.bottom;
};

 This example should result in VoiceOver describing axis title and its visible range upon clicking.

VoiceOver for visible range updates

The visible range changes detection on an axis could be added as following:

Visible range changes detection
Copy Code
const announceYRangeChange = debounce(announceWithSpeechSynthesis);
const announceXRangeChange = debounce(announceWithSpeechSynthesis);
// add announcement of axis range changes
yAxis.visibleRangeChanged.subscribe((args) => {
    const { min, max } = args.visibleRange;
    const from = yAxis.labelProvider.formatLabel(min);
    const to = yAxis.labelProvider.formatLabel(max);
    const announcement = `${yAxis.axisTitle} range changed, now it's from ${from} to ${to}.`;
    announceYRangeChange(announcement);
});
xAxis.visibleRangeChanged.subscribe((args) => {
    const { min, max } = args.visibleRange;
    const from = xAxis.labelProvider.formatLabel(min);
    const to = xAxis.labelProvider.formatLabel(max);
    const announcement = `${xAxis.axisTitle} range changed, now it's from ${from} to ${to}.`;
    announceXRangeChange(announcement);
});

 Let's add some zoom&pan modifiers to demonstrate the result:

Add modifiers
Copy Code
import { MouseWheelZoomModifier } from "scichart/Charting/ChartModifiers/MouseWheelZoomModifier";
import { ZoomExtentsModifier } from "scichart/Charting/ChartModifiers/ZoomExtentsModifier";
import { ZoomPanModifier } from "scichart/Charting/ChartModifiers/ZoomPanModifier";
// ...
sciChartSurface.chartModifiers.add(
    new ZoomPanModifier(),
    new ZoomExtentsModifier(),
    new MouseWheelZoomModifier(),
);

 Now when using the chart modifiers you should be able to observe them getting logged to the console.

See Also